Statistics in Pascal
Statistics about your organisation can help you get a better insight in the work still to be done and where help is needed.
- Viewing statistics on the resolvement status
- Viewing statistics on your team's activity
- Viewing statistics about cases
- Monitoring reports
Viewing statistics on the resolvement status
This documentation, including images, videos and text, is accurate as of Version 5.12 of Pascal.
We strive to keep our documentation up to date with each release to ensure it remains a reliable resource for our users. However, given the dynamic nature of our software development, there might be instances where changes introduced in subsequent versions are not immediately reflected in this documentation. We encourage users to refer to the latest release notes and to use the feedback mechanism for any discrepancies or requests for clarification.
The Resolvement tab in the statistics of Pascal shows the case overview in terms of unresolved hits of cases assigned to users. It includes a title with resolution status, which highlights some general statistics.
This view can be filtered on users, when no users are selected, all users will be shown in this overview.
If your account does not have an admin or owner role, you will not have the option to filter on users and will only see your own statistics.
Progress
In the Progress card, the users selected in the filter are visible with some resolving information. Unresolved hits shows the percentage of hits that the user has resolved against all hits the user is responsible for. Monitored cases presents the number of cases this user is responsible for which are being monitored. The last activity of the users indicates the last time they have done an action in the Pascal organisation.
Unresolved hits
This card shows the total number of unresolved hits for all users selected in the filters at the top of this page. If no users are selected, the unresolved hits in the whole organisation are presented here.
Unresolved hits by source
This card shows per user for every source how many hits are left to resolve. All users selected in the filter will be shown in this table. If no users are selected, all users in the Pascal organisation will be shown here.
Unresolved hits by risk
This table shows the unresolved hits for every selected user, based on the risk associated with the still to resolve hits. The colour dark red indicates hits with a very high risk, red indicates a high risk, orange indicates a moderate risk, dark green indicates a low risk and light green indicates a very low risk.

Viewing statistics on your team's activity
This documentation, including images, videos and text, is accurate as of Version 5.12 of Pascal.
We strive to keep our documentation up to date with each release to ensure it remains a reliable resource for our users. However, given the dynamic nature of our software development, there might be instances where changes introduced in subsequent versions are not immediately reflected in this documentation. We encourage users to refer to the latest release notes and to use the feedback mechanism for any discrepancies or requests for clarification.
The tab Activity shows an overview of the performance of users in Pascal, based on cases assigned to users.
If your account does not have an admin or owner role, you will not be able to see this tab in the Statistics of Pascal.
Filters
The available filters for the statistics visible on this page, are a time filter and a user filter.
The Filter by user can be used to filter on specific users or all users in a specific group. Users are listed in this filter by group, if a user is a part of multiple groups, they will be presented multiple times. It is also possible to select all users from a group at once by using the Add all button besides the title of the group.
The time filter besides the user filter, can be used to see statistics from a certain period of time.
Clients handled
The number shown in this card, is the number of clients that have been worked on in the selected time frame by the selected user(s).
Cases handled
The number shown in this card, is the number of cases that have been worked on in the selected time frame by the selected user(s).
Resolved hits
The number shown in this card, is the number of hits that have been resolved in the selected time frame by the selected user(s).
All activity
The chart in the top of the view, shows the activity of the selected users in the selected time frame. This table shows for each selected user the clients this user handled, the cases this user handled, how many hits this user has resolved and the moment the activity took place.
Resolved by source
This table shows all users which are selected in the filter. It displays how many hits have been resolved by each user for each hit source.
Resolved by risk
The Resolved by risk card gives an overview of all users which are selected in the filters. For these users, it shows how many hits they have resolved based on the risk. The colour dark red indicates hits with a very high risk classification, red indicates a high risk, orange indicates a moderate risk, dark green indicates a low risk and light green indicates a very low risk.

Total resolved hits
This chart, based on the time frame selected, shows the activity in the number of resolved hits in the selected time frame. When hovering with the mouse over the bar in the graph, the specific number is shown with the date the bar indicates.
Total unresolved hits
This chart, based on the time frame selected, shows the total amount of unresolved hits in the selected time frame. When hovering with the mouse over the bar in the graph, the specific number is shown with the date the bar indicates.
Viewing statistics about cases
This documentation, including images, videos and text, is accurate as of Version 6.2 of Pascal.
We strive to keep our documentation up to date with each release to ensure it remains a reliable resource for our users. However, given the dynamic nature of our software development, there might be instances where changes introduced in subsequent versions are not immediately reflected in this documentation. We encourage users to refer to the latest release notes and to use the feedback mechanism for any discrepancies or requests for clarification.
The Case tab in the Statistics section shows various metrics on the composition of cases assigned to users.
If your account does not have an admin or owner role, you will only be able to see your own Case statistics.
Case inputs used
This overview shows per case input field how often the fields are used in existing cases in your Pascal organisations.
Person cases by nationality
This card shows all nationalities of the person cases currently active in your Pascal organisation. Requirements for nationalities to show up here are that the percentages should be at least 5% if the percentage is less, the nationalities will be added to other in the bar chart. Additionally, only 10 bars can show up in this bar chart, so all other nationalities will be added to the other as well.
The bars can also be selected to view the cases with this nationality.
Business cases by country
This card shows all countries of the business cases currently active in your Pascal organisation. Requirements for countries to show up here are that the percentages should be at least 5% if the percentage is less, the country will be added to the other in the bar chart. Additionally, only 10 bars can show up in this bar chart, so all other countries will be added to the other bar as well.
The bars can also be selected to view the cases with this country.
Cases by risk
The Cases by risk card shows all cases of the organisation, or if there is filtered on specific users only their cases, sorted by the risk of those cases. This is only based on included hits like the risk card itself in a case's overview.
Monitoring reports
Cases which are being monitored, can receive new unresolved hits if during monitoring new findings are found. Cases and the sources within cases can have different frequencies in which they are monitored. To easily and clearly present these new findings to you, these results are gathered and sumarised in one report.
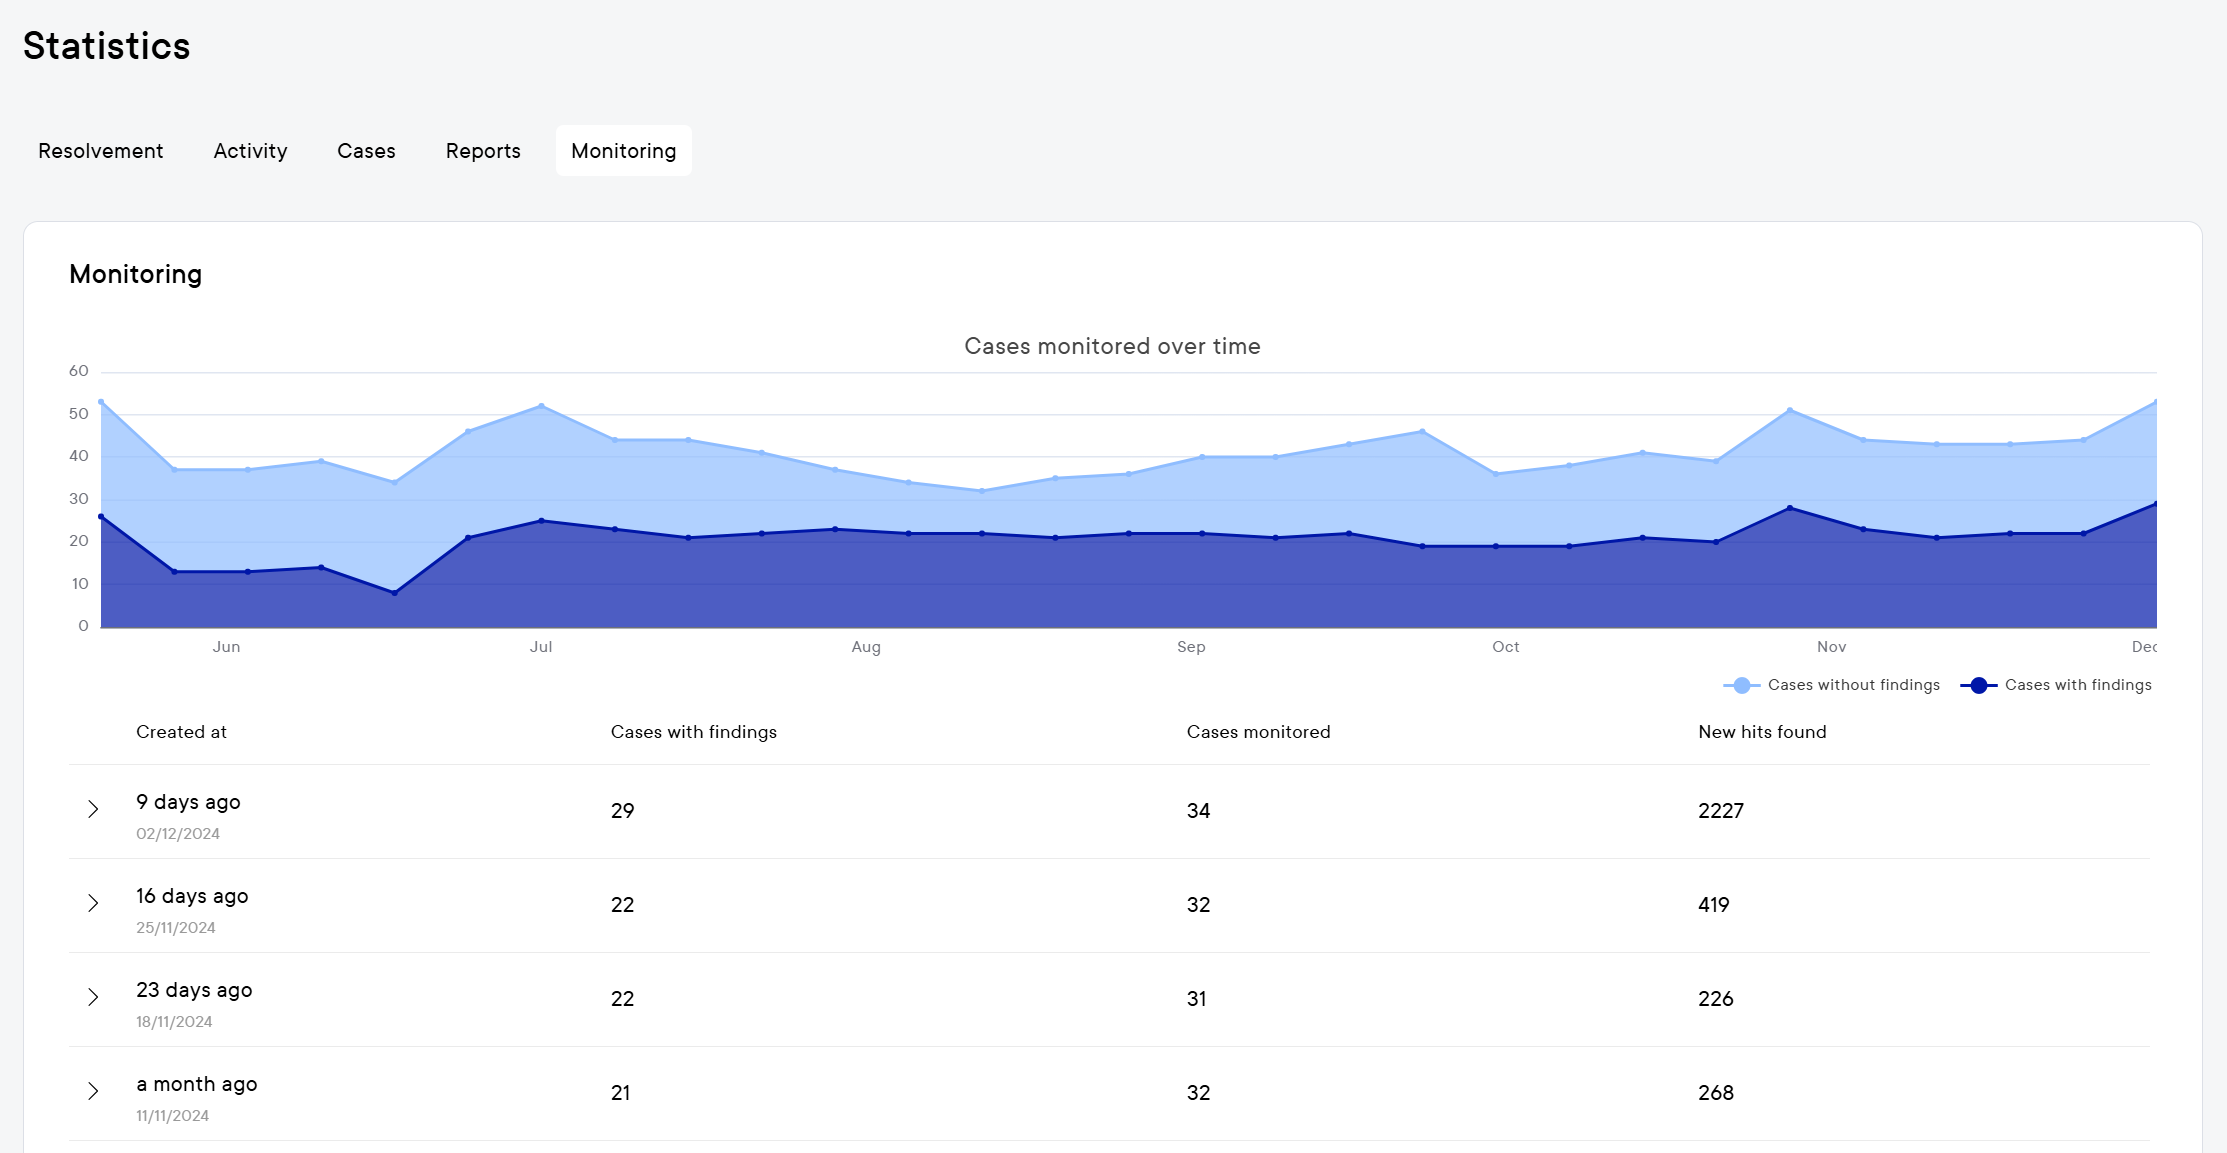
In the table, you are able to see:
- The date of the report
- The cases in which new findings were found
- How many cases were searched during monitoring
- The number of new hits found and sumarised in the report
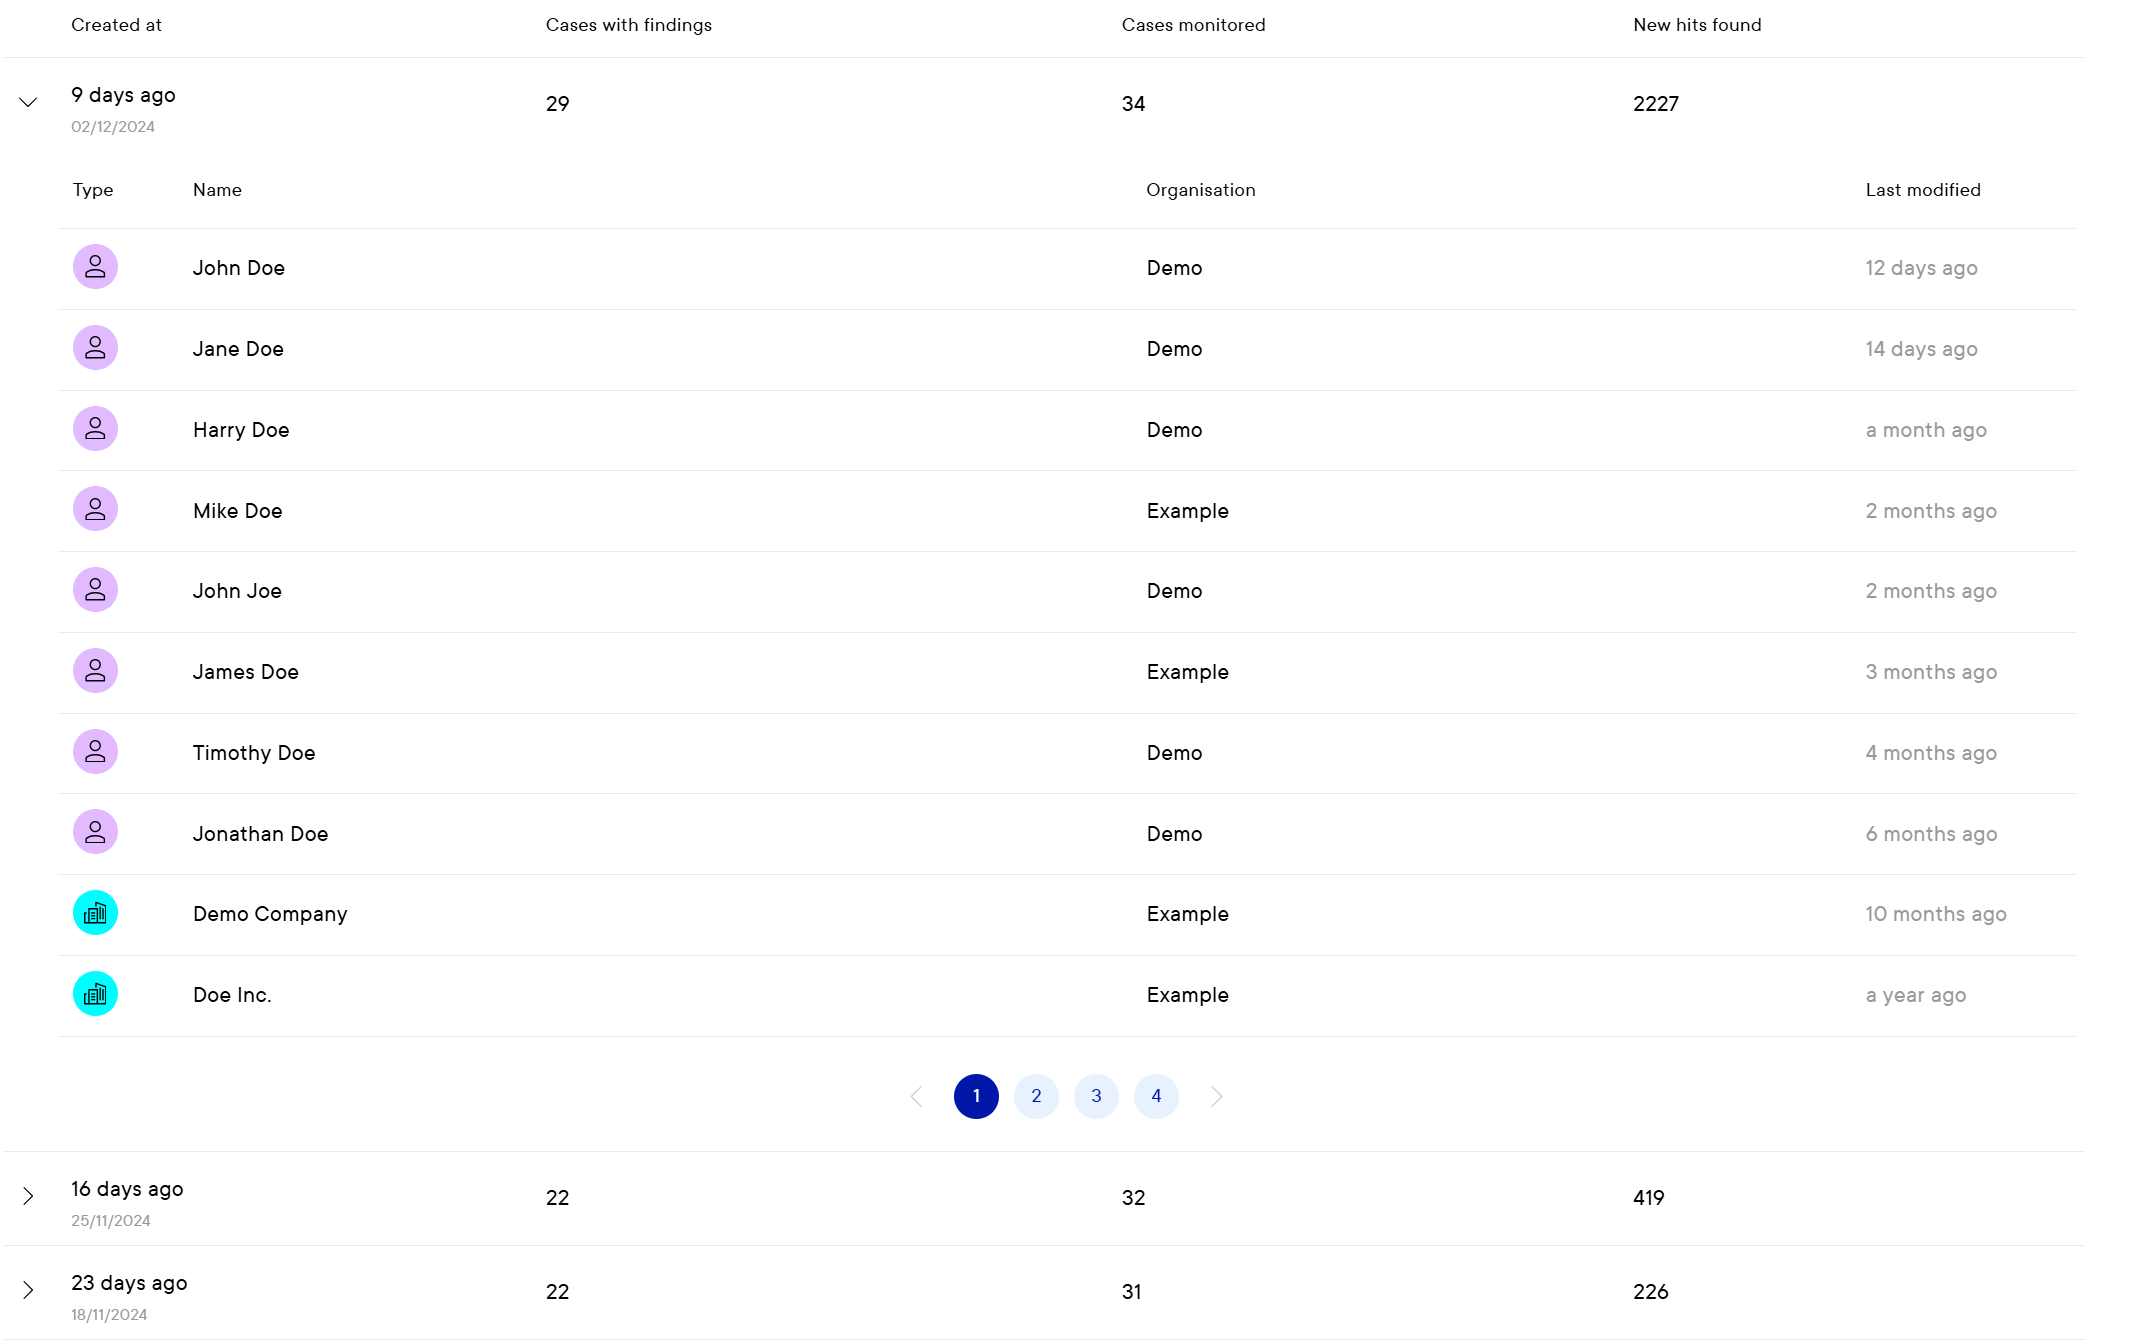
When opening one of these reports, details are presented regarding the specific cases in which new findings are found. The type of case and case name are showcased. If you have several different Pascal organisations you are working in, you will see the organisation this case can be found in. And lastly, the last modified shows the last time the case was modified or resolved by a user. In this overview, you can click on a case to quickly navigate towards the case and its new findings.
The frequency in which a user receives this report, can be customised in the Configuration tab in a user's Account Settings. The setting if the user prefers to receive the reports via email and without any new findings, can also be altered there.