Viewing statistics on your team's activity
This documentation, including images, videos and text, is accurate as of Version 5.12 of Pascal.
We strive to keep our documentation up to date with each release to ensure it remains a reliable resource for our users. However, given the dynamic nature of our software development, there might be instances where changes introduced in subsequent versions are not immediately reflected in this documentation. We encourage users to refer to the latest release notes and to use the feedback mechanism for any discrepancies or requests for clarification.
The tab Activity shows an overview of the performance of users in Pascal, based on cases assigned to users.
If your account does not have an admin or owner role, you will not be able to see this tab in the Statistics of Pascal.
Filters
The available filters for the statistics visible on this page, are a time filter and a user filter.
The Filter by user can be used to filter on specific users or all users in a specific group. Users are listed in this filter by group, if a user is a part of multiple groups, they will be presented multiple times. It is also possible to select all users from a group at once by using the Add all button besides the title of the group.
The time filter besides the user filter, can be used to see statistics from a certain period of time.
Clients handled
The number shown in this card, is the number of clients that have been worked on in the selected time frame by the selected user(s).
Cases handled
The number shown in this card, is the number of cases that have been worked on in the selected time frame by the selected user(s).
Resolved hits
The number shown in this card, is the number of hits that have been resolved in the selected time frame by the selected user(s).
All activity
The chart in the top of the view, shows the activity of the selected users in the selected time frame. This table shows for each selected user the clients this user handled, the cases this user handled, how many hits this user has resolved and the moment the activity took place.
Resolved by source
This table shows all users which are selected in the filter. It displays how many hits have been resolved by each user for each hit source.
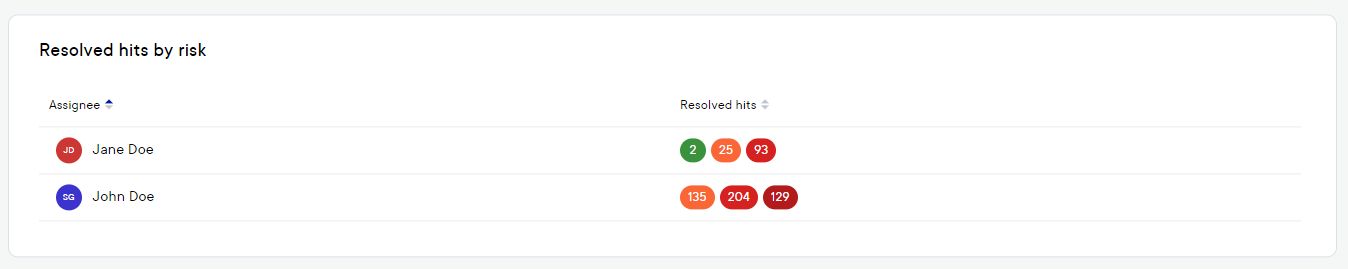
Resolved by risk
The Resolved by risk card gives an overview of all users which are selected in the filters. For these users, it shows how many hits they have resolved based on the risk. The colour dark red indicates hits with a very high risk classification, red indicates a high risk, orange indicates a moderate risk, dark green indicates a low risk and light green indicates a very low risk.
Total resolved hits
This chart, based on the time frame selected, shows the activity in the number of resolved hits in the selected time frame. When hovering with the mouse over the bar in the graph, the specific number is shown with the date the bar indicates.
Total unresolved hits
This chart, based on the time frame selected, shows the total amount of unresolved hits in the selected time frame. When hovering with the mouse over the bar in the graph, the specific number is shown with the date the bar indicates.